Outbound Pipeline Math in 2026: How to Reverse-Engineer Quota Into Daily Prospecting Targets
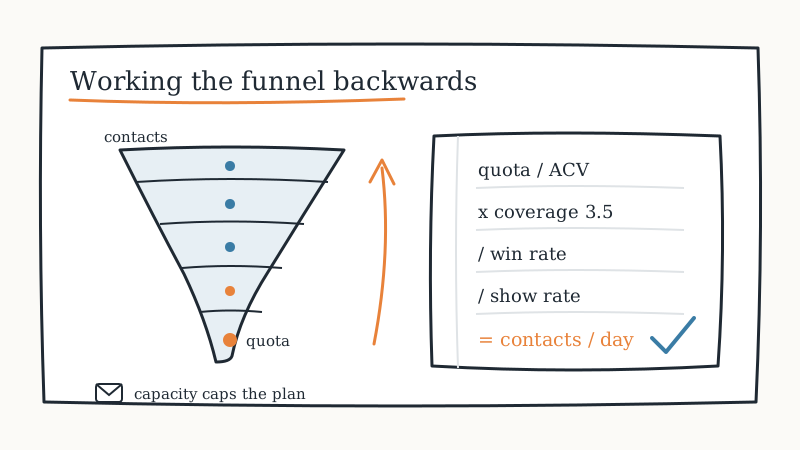
Most outbound plans start in the wrong place. A leader picks a sending volume that feels ambitious, the team runs it for a quarter, and then everyone reverse-engineers a story about why the number landed where it landed. The alternative takes an afternoon: start at the revenue target, divide your way back up the funnel, and arrive at a daily contact count that is either achievable or obviously not. That second answer is the valuable one, because a plan that fails on paper in October is far cheaper than one that fails in the pipeline review in January. This guide walks the outbound pipeline math end to end, shows a full worked example, and covers the sending-capacity ceiling that quietly invalidates most quota models. It is the planning companion to our breakdown of the outbound sales KPIs that actually predict pipeline, and it is how GroomLead sizes a motion before a single mailbox gets provisioned.
What is outbound pipeline math?
Outbound pipeline math is the practice of converting a revenue target into the specific volume of qualified contacts a team must reach each day, by dividing the target through every conversion rate in the funnel in reverse order. Instead of asking “how many emails can we send,” it asks “how many emails must we send,” and then separately asks whether that number is physically possible given your domains, your list size, and your rep capacity.
The distinction matters because the two questions produce very different plans. Capacity-first planning produces a motion that runs at whatever volume the tooling allows and hopes the output clears quota. Target-first planning produces a required number, compares it against capacity, and surfaces the gap while there is still time to close it by buying more sending infrastructure, tightening the ICP, or lowering the target.
The one formula behind the whole model
Every version of this calculation is the same chain of division. You begin with closed revenue and divide by each conversion rate between that outcome and a first touch.
Contacts needed =
  (Revenue target / Average deal size)   -> deals needed
  / Opportunity win rate                 -> opportunities needed
  x Pipeline coverage ratio              -> pipeline to create
  / Meeting-to-opportunity rate          -> meetings held needed
  / Show rate                            -> meetings booked needed
  / Positive-reply-to-meeting rate       -> positive replies needed
  / Positive reply rate                  -> contacts needed
Two notes on the chain. First, pipeline coverage sits near the top because it governs how much more pipeline than quota you must create to absorb normal slippage. Second, show rate gets its own line rather than being folded into the meeting rate, because it is the single most commonly ignored leak in the model and it is independently fixable.
Step 1: Start from the revenue number, not the activity number
Write down the outbound-sourced revenue target for the period, which is almost never the whole company target. If the company needs $6M and historically half of closed revenue comes from inbound, partnerships, and expansion, the outbound number is $3M. Planning the outbound motion against the full company number is the most common way teams end up with a daily contact target nobody can hit.
Divide that figure by average contract value to get deals needed. A $3M outbound target at a $60,000 ACV needs 50 closed deals in the period. Use median deal size rather than mean if your distribution has a few large outliers, because the mean will flatter the plan and understate the volume required.
Step 2: Apply a pipeline coverage ratio
Pipeline coverage ratio is the multiple of quota you need in open pipeline for the quota to actually close. A 3x coverage ratio means you carry $3 of open opportunity for every $1 of target. The right multiple is simply the inverse of your realistic win rate plus a buffer for slippage into the next period.
| Opportunity win rate | Minimum coverage | Practical coverage to plan for |
|---|---|---|
| 15% | 6.7x | 7x to 8x |
| 20% | 5.0x | 5x to 6x |
| 25% | 4.0x | 4x to 5x |
| 30% | 3.3x | 3.5x to 4x |
| 40% | 2.5x | 3x |
Do not borrow a coverage ratio from a benchmark article. Calculate your own from the last four quarters: total pipeline that existed at the start of each quarter, divided by revenue that closed in it. If that number has been drifting upward while revenue stayed flat, your pipeline is inflating with opportunities that were never real, which is a qualification problem rather than a volume problem. Our B2B lead qualification framework covers the scoring fix.
Step 3: Convert pipeline into meetings held
Every opportunity in your pipeline started as a meeting that happened. The meeting-to-opportunity rate is the share of held first meetings that produce a qualified opportunity, and in a well-targeted outbound motion it typically lands between 30% and 50%. Below 30%, you are booking meetings with people who were never going to buy, which traces back to the list rather than the pitch. Our guide to building an ideal customer profile for B2B outbound is the upstream fix.
Then divide by show rate to get meetings booked. A held meeting and a booked meeting are not the same unit, and treating them as one is how a model silently loses a quarter of its output. Cold-sourced outbound meetings commonly show at 55% to 75%, so the gap is material. The full set of countermeasures lives in our sales meeting no-show rate playbook.
Step 4: Walk back from meetings to contacts touched
The last two divisions take you from booked meetings to the top of the funnel.
- Positive-reply-to-meeting rate. The share of interested replies that convert into a scheduled meeting. In teams that answer replies the same day, this runs 40% to 60%. In teams where replies sit overnight, it collapses toward 20%, and that collapse is pure arithmetic in the model: halving this rate doubles the contacts you need.
- Positive reply rate. The share of contacted prospects who respond with genuine interest rather than an objection, an out-of-office, or an unsubscribe. Across well-run multi-channel outbound in 2026 this lands between 1.5% and 4%, against raw reply rates two to three times higher.
Note what the first bullet implies. Reply speed is not a nice-to-have in this model, it is a multiplier on every number above it. That is why we run Underfive across sending accounts on any motion planned this way: it pulls every mailbox into one inbox, labels incoming replies, and has an inbox agent draft a context-aware answer in under five minutes, so an interested prospect gets handled while the intent is still live instead of the next morning. The deeper version of the argument is in our speed-to-lead response time playbook.
A worked example: $3M in outbound-sourced revenue
Here is the full chain for a quarter, using the numbers above. Read it top to bottom as a single division sequence.
| Step | Calculation | Result |
|---|---|---|
| Outbound revenue target | given | $3,000,000 |
| Deals needed | $3,000,000 / $60,000 ACV | 50 deals |
| Pipeline to create (4x coverage) | 50 deals x 4 | 200 opportunities |
| Meetings held needed | 200 / 40% meeting-to-opp | 500 meetings held |
| Meetings booked needed | 500 / 65% show rate | 770 meetings booked |
| Positive replies needed | 770 / 50% reply-to-meeting | 1,540 positive replies |
| Contacts needed | 1,540 / 2.5% positive reply rate | 61,600 contacts |
| Contacts per working day | 61,600 / 63 days | 978 per day |
Roughly a thousand qualified, in-ICP contacts reached every working day. That is the honest answer, and it is usually the first time the plan becomes a real conversation. Three things typically happen next: someone questions whether 61,600 in-ICP contacts even exist in the addressable market, someone questions whether the infrastructure can carry 978 touches a day, and someone proposes improving a conversion rate instead of adding volume. All three are correct instincts, and the model is what made them visible.
Step 5: Check the answer against sending capacity
A target volume is only a plan if the infrastructure can carry it. Work out the ceiling separately and compare.
Cold outreach mailboxes should send somewhere between 20 and 40 emails per day each to stay inside safe reputation limits, and each sending domain should host roughly three mailboxes. At 30 emails per mailbox per day, 978 daily first touches needs about 33 mailboxes and 11 dedicated domains, before you add the follow-up steps in the sequence, which multiply total send volume by three or four. Pushing past those per-mailbox limits to make the math work is how teams trade a reputation problem for a volume problem and end up with both. The constraints are laid out in our cold email deliverability guide.
The capacity check usually produces one of four honest outcomes, and naming which one you are in is the whole point of the exercise.
- Capacity exceeds the requirement. Rare. Tighten the ICP and spend the surplus on depth per account rather than reach.
- Capacity is close. Provision the extra domains now, because new domains need weeks of warmup before they carry real volume.
- Capacity is far short, but conversion rates are weak. Fix the ratios. A positive reply rate moving from 2.5% to 3.5% cuts the required contact volume by 29% with no new infrastructure at all.
- Capacity is far short and the ratios are already strong. The target is wrong, or the channel mix is. Add a second channel or renegotiate the number before the quarter starts.
There is a second capacity ceiling the mailbox math does not show, and it is human. A thousand contacts a day only converts at the rate you planned if each one is researched and written to properly, and that quality is what degrades first when volume climbs. This is the constraint VSDR exists to lift: an AI sales development rep that researches each account and writes an individually personalized first touch across the full sequence at a controlled, human-like pace, so the positive reply rate in your model survives contact with the volume in your model.
Which ratio should you fix first?
When the model says you need more volume than you can produce, improving a conversion rate is almost always cheaper than adding capacity, because every rate improvement compounds through every step below it. Fix them in this order, from the cheapest and most leveraged down.
| Ratio | Fix it by | Why it is high leverage |
|---|---|---|
| Positive-reply-to-meeting | Answering replies in minutes, not days | Pure execution speed, no new spend, immediate effect |
| Show rate | Confirmation sequences and shorter book-to-meet gaps | Recovers meetings you already paid to book |
| Positive reply rate | Better targeting and event-timed outreach | Divides the top of the funnel directly |
| Bounce rate | Verifying and enriching records at send time | Protects every downstream rate at once |
| Meeting-to-opportunity | Tighter ICP and qualification scoring | Stops the pipeline inflating with unreal deals |
Three of those rows deserve a practical note. Timing is the largest single input into positive reply rate, and timing comes from observed events rather than a calendar: CAM turns job changes, social activity, competitor connections, and website behavior into dated buying signals and lead lists, so a touch lands in a window instead of at random. The highest-converting timing signal of all is a past champion landing in a new role, and Champions surfaces those moves the week they happen, which is why a small tracked-champion segment often carries a positive reply rate several times the blended number. And bounce rate is a data-freshness problem rather than a messaging one, which is why enriching each record at the moment of outreach matters more than a quarterly list refresh. Triguna returns current firmographic and contact data from a domain or profile at send time, so the record you touch is real today. Our piece on B2B data decay and CRM hygiene covers that maintenance loop.
How often should you re-run the model?
Monthly, with a hard rule: update the conversion rates from actuals before you touch the target. A model that keeps its original assumptions for a full quarter is a forecast of a company you no longer run.
Three triggers should force an off-cycle re-run regardless of the calendar. A pricing or packaging change, because it moves ACV and the deal count with it. A new segment or geography, because its conversion rates are not your blended ones and blending them hides the difference. And any infrastructure change, because adding or burning domains moves the capacity ceiling the whole plan rests on.
The outbound pipeline math checklist
- Use the outbound-sourced revenue target, not the company target.
- Divide by median deal size rather than the mean.
- Calculate your own pipeline coverage ratio from four quarters of actuals.
- Keep show rate as its own division step, never folded into the meeting rate.
- Carry positive reply rate, not raw reply rate, into the final division.
- Convert the period total into a per-working-day contact target.
- Compute the sending-capacity ceiling independently and compare the two numbers.
- Provision and warm new domains weeks before the volume is needed.
- Improve the cheapest conversion ratio before buying more capacity.
- Re-run monthly from actuals, and immediately after any pricing, segment, or infrastructure change.
The point of this exercise is not forecasting accuracy, because no outbound model is accurate to the dollar. The point is that it converts an argument about ambition into an argument about arithmetic, and arithmetic is something a team can actually fix. If you want the model built against your real numbers and the infrastructure sized to match, GroomLead does exactly that before building the motion.
Ready to engineer your own GTM system?
GroomLead engineers outbound systems for B2B teams, and builds the tools inside this post.
Book Strategy Call